Note
Go to the end to download the full example code.
SKADA logo generation
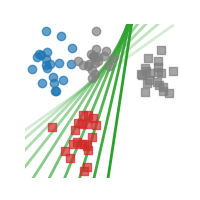
In this example we plot the logos of the SKADA toolbox.
This logo is that it is done 100% in Python and generated using matplotlib and plotting the solution of the EMD solver from POT.
# Author: Théo Gnassounou
#
# License: BSD 3-Clause
# sphinx_gallery_thumbnail_number = 1
from math import factorial

import matplotlib.pyplot as plt
import numpy as np

plt.rcParams.update({"text.usetex": True, "font.family": "Computer Modern"})

color_S = "black"
color_1 = "#2364aa"
color_0 = "#c84630"
color_unlabel = "#999c81"


def comb(n, k):
    return factorial(n) // (factorial(k) * factorial(n - k))


def bezier_curve(t, points):
    n = len(points) - 1
    return sum(comb(n, i) * (1 - t) ** (n - i) * t**i * points[i] for i in range(n + 1))


def draw_S(
    start_length=9,
    length_step=2.5,
    final_angle=70,
    angle_step=18,
    s=30,
    alpha=0.9,
    linewidths=1,
    random_state=42,
    figsize=(2, 2),
    white=False,
):
    rng = np.random.RandomState(random_state)

    # Create a figure and axis
    fig = plt.figure(1, figsize)
    if figsize == (2, 2):
        plt.xlim(-1, 11)
    else:
        plt.xlim(-1, 35)

    # Define the control points for the Bézier curve
    points = np.array([[2, 8], [4, 10], [6, 0], [8, 2]])

    # Generate the S shape
    t_values = np.linspace(-0.3, 1.3, 100)
    curve = np.array([bezier_curve(t, points) for t in t_values])

    for i, angle in enumerate(range(0, final_angle, angle_step)):
        rotation_center = np.mean(curve, axis=0)
        rotation_angle = np.radians(angle)
        rotation_matrix = np.array(
            [
                [np.cos(rotation_angle), -np.sin(rotation_angle)],
                [np.sin(rotation_angle), np.cos(rotation_angle)],
            ]
        )
        rotated_curve = (
            np.dot(curve - rotation_center, rotation_matrix) + rotation_center
        )

        # Plot the S shape
        plt.plot(
            rotated_curve[:, 1],
            rotated_curve[:, 0],
            color=color_S if not white else "w",
            linewidth=start_length - length_step * i,
            alpha=1 - i / (final_angle / angle_step),
            solid_capstyle="round",
        )

    # Plot the S shape
    plt.plot(
        curve[:, 1],
        curve[:, 0],
        color=color_S if not white else "w",
        linewidth=2,
        solid_capstyle="round",
    )
    n_dots = 200
    max = 2
    min = 1
    dots = rng.rand(n_dots, 2) * 10
    dots_class = []
    dots_keep = []
    for i, dot in enumerate(dots):
        # get the closest x axis point of the curve of dot
        closest_point = curve[np.argmin(np.abs(curve[:, 0] - dot[0]))]
        if (abs(closest_point[1] - dot[1]) < max) & (
            abs(closest_point[1] - dot[1]) > min
        ):
            dots_keep.append(dot)
            if closest_point[1] > dot[1]:
                dots_class.append(1)
            else:
                dots_class.append(0)

    dots_keep = np.array(dots_keep)
    dots_class = np.array(dots_class)

    plt.scatter(
        dots_keep[dots_class == 0, 1],
        dots_keep[dots_class == 0, 0],
        color=color_unlabel if not white else "w",
        marker="o",
        s=s,
        alpha=alpha,
        linewidths=linewidths,
    )

    plt.scatter(
        dots_keep[dots_class == 1, 1],
        dots_keep[dots_class == 1, 0],
        color=color_unlabel if not white else "w",
        marker="s",
        s=s,
        alpha=alpha,
        linewidths=linewidths,
    )

    dots_rotated = (
        np.dot(dots_keep - rotation_center, rotation_matrix) + rotation_center
    )

    plt.scatter(
        dots_rotated[dots_class == 0, 1],
        dots_rotated[dots_class == 0, 0],
        color=color_1 if not white else "w",
        marker="o",
        s=s,
        alpha=alpha,
        linewidths=linewidths,
    )

    plt.scatter(
        dots_rotated[dots_class == 1, 1],
        dots_rotated[dots_class == 1, 0],
        color=color_0 if not white else "w",
        marker="s",
        s=s,
        alpha=alpha,
        linewidths=linewidths,
    )

    # Hide axes
    plt.axis("off")

    return fig
fig = draw_S(figsize=(2, 2))

# Save the figure
plt.savefig(
    "skada_logo.svg",
    dpi=300,
)
plt.savefig(
    "skada_logo.pdf",
    dpi=300,
)

fig = draw_S(figsize=(6, 2))

fontsize = 85
y_axis = 1.5
plt.text(
    10,
    y_axis,
    r"\bf\textsf{K}",
    usetex=True,
    fontsize=fontsize,
    color="black",
)
plt.text(
    17,
    y_axis,
    r"\bf\textsf{A}",
    usetex=True,
    fontsize=fontsize,
    color="black",
)
plt.text(
    23.5,
    y_axis,
    r"\bf\textsf{D}",
    usetex=True,
    fontsize=fontsize,
    color=color_1,
)
plt.text(
    30.5,
    y_axis,
    r"\bf\textsf{A}",
    usetex=True,
    fontsize=fontsize,
    color=color_0,
)

# plt.tight_layout()
# Save the figure
plt.savefig(
    "skada_logo_full.svg",
    dpi=300,
    bbox_inches="tight",
)
plt.savefig(
    "skada_logo_full.pdf",
    dpi=300,
    bbox_inches="tight",
)

fig = draw_S(figsize=(6, 2), white=True)

fontsize = 85
y_axis = 1.5
plt.text(
    10,
    y_axis,
    r"\bf\textsf{K}",
    usetex=True,
    fontsize=fontsize,
    color="w",
)
plt.text(
    17,
    y_axis,
    r"\bf\textsf{A}",
    usetex=True,
    fontsize=fontsize,
    color="w",
)
plt.text(
    23.5,
    y_axis,
    r"\bf\textsf{D}",
    usetex=True,
    fontsize=fontsize,
    color="w",
)
plt.text(
    30.5,
    y_axis,
    r"\bf\textsf{A}",
    usetex=True,
    fontsize=fontsize,
    color="w",
)


# Save the figure
plt.savefig("skada_logo_full_white.svg", transparent=True)
plt.savefig("skada_logo_full_white.pdf", transparent=True)

Total running time of the script: (0 minutes 1.455 seconds)