Note
Go to the end to download the full example code.
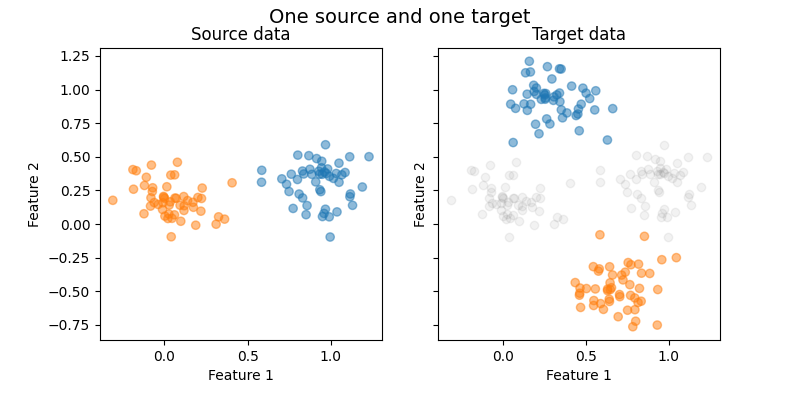
Plot dataset source domain and shifted target domain
This illustrates the make_dataset_from_moons_distribution()
dataset generator. Each method consists of generating source data
and shifted target data.
import matplotlib.pyplot as plt
import numpy as np

from skada import source_target_split
from skada.datasets import make_dataset_from_moons_distribution

# Use same random seed for multiple calls to make_shifted_datasets to
# ensure same distributions
RANDOM_SEED = np.random.randint(2**10)
X, y, sample_domain = make_dataset_from_moons_distribution(
    pos_source=0.1,
    pos_target=0.4,
    n_samples_source=50,
    n_samples_target=50,
    noise=0.1,
    random_state=RANDOM_SEED,
)

X_source, X_target, y_source, y_target = source_target_split(
    X, y, sample_domain=sample_domain
)

fig, (ax1, ax2) = plt.subplots(1, 2, sharex="row", sharey="row", figsize=(8, 4))
fig.suptitle("One source and one target", fontsize=14)
plt.subplots_adjust(bottom=0.15)
ax1.scatter(
    X_source[:, 0],
    X_source[:, 1],
    c=y_source,
    cmap="tab10",
    vmax=10,
    alpha=0.5,
)
ax1.set_title("Source data")
ax1.set_xlabel("Feature 1")
ax1.set_ylabel("Feature 2")

ax2.scatter(
    X_source[:, 0],
    X_source[:, 1],
    c="grey",
    cmap="tab10",
    vmax=10,
    alpha=0.1,
)
ax2.scatter(
    X_target[:, 0],
    X_target[:, 1],
    c=y_target,
    cmap="tab10",
    vmax=10,
    alpha=0.5,
)
ax2.set_title("Target data")
ax2.set_xlabel("Feature 1")
ax2.set_ylabel("Feature 2")

plt.show()
/home/circleci/project/examples/datasets/plot_dataset_from_moons_distribution.py:51: UserWarning: No data for colormapping provided via 'c'. Parameters 'cmap', 'vmax' will be ignored
  ax2.scatter(
X, y, sample_domain = make_dataset_from_moons_distribution(
pos_source=[0.1, 0.3, 0.5],
pos_target=[0.4, 0.9],
n_samples_source=50,
n_samples_target=50,
noise=0.1,
random_state=RANDOM_SEED,
)
X_source, X_target, y_source, y_target, domain_source, domain_target = (
source_target_split(X, y, sample_domain, sample_domain=sample_domain)
)
fig, (ax1, ax2) = plt.subplots(1, 2, sharex="row", sharey="row", figsize=(8, 4))
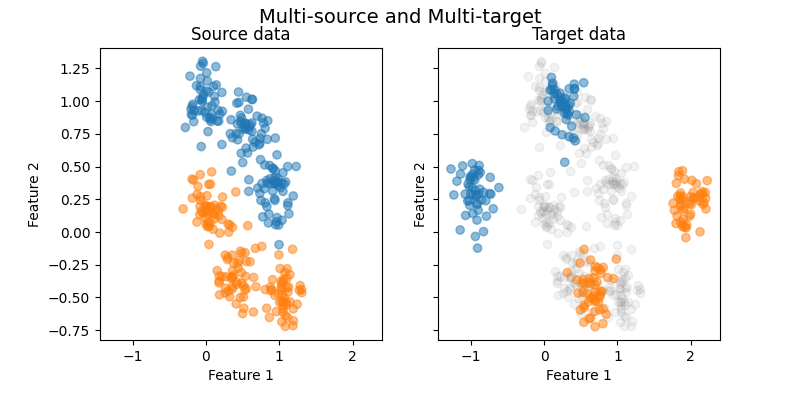
fig.suptitle("Multi-source and Multi-target", fontsize=14)
plt.subplots_adjust(bottom=0.15)
for i in np.unique(domain_source):
ax1.scatter(
X_source[domain_source == i, 0],
X_source[domain_source == i, 1],
c=y_source[domain_source == i],
cmap="tab10",
vmax=10,
alpha=0.5,
)
ax1.set_title("Source data")
ax1.set_xlabel("Feature 1")
ax1.set_ylabel("Feature 2")
for i in np.unique(domain_source):
ax2.scatter(
X_source[domain_source == i, 0],
X_source[domain_source == i, 1],
c="grey",
cmap="tab10",
vmax=10,
alpha=0.1,
)
for i in np.unique(domain_target):
ax2.scatter(
X_target[domain_target == i, 0],
X_target[domain_target == i, 1],
c=y_target[domain_target == i],
cmap="tab10",
vmax=10,
alpha=0.5,
)
ax2.set_title("Target data")
ax2.set_xlabel("Feature 1")
ax2.set_ylabel("Feature 2")
plt.show()
print(f"The data was generated from (random_state={RANDOM_SEED})")
/home/circleci/project/examples/datasets/plot_dataset_from_moons_distribution.py:105: UserWarning: No data for colormapping provided via 'c'. Parameters 'cmap', 'vmax' will be ignored
  ax2.scatter(
The data was generated from (random_state=690)
Total running time of the script: (0 minutes 0.291 seconds)