Note
Go to the end to download the full example code.
Plot dataset source domain and shifted target domain
This illustrates the make_variable_frequency_dataset()
dataset generator. Each method consists of generating source data
and shifted target data.
import matplotlib.pyplot as plt
import numpy as np

from skada import source_target_split
from skada.datasets import make_variable_frequency_dataset

# Use same random seed for multiple calls to make_datasets to
# ensure same distributions
RANDOM_SEED = np.random.randint(2**10)
X, y, sample_domain = make_variable_frequency_dataset(
    n_samples_source=1,
    n_samples_target=1,
    n_channels=3,
    n_frequencies=2,
    n_classes=2,
    delta_f=2,
    band_size=1,
    sigma_ch=1,
    noise=0.2,
    random_state=RANDOM_SEED,
)

X_source, X_target, y_source, y_target = source_target_split(
    X, y, sample_domain=sample_domain
)
fig, ax = plt.subplots(3, 2, sharex="all", sharey="all", figsize=(8, 4))
plt.subplots_adjust(bottom=0.15)
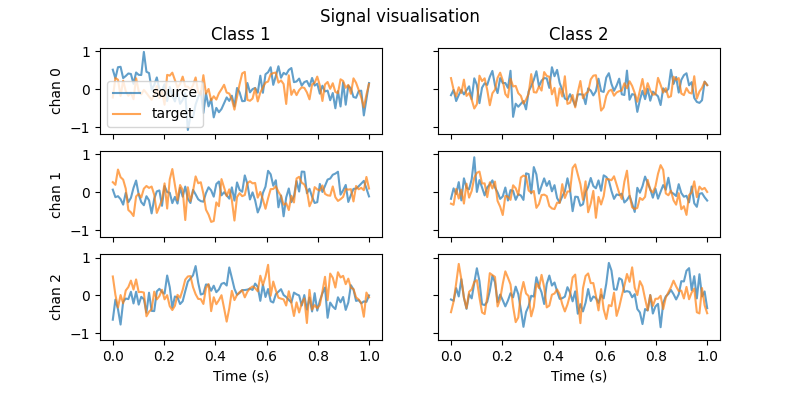
fig.suptitle("Signal visualisation")
time = np.linspace(0, 1, 100)
for i in range(3):
ax[i, 0].plot(time, X_source[0, i, 1000:1100], alpha=0.7, label="source")
ax[i, 0].set_ylabel(f"chan {i}")
ax[i, 0].plot(time, X_target[0, i, 1000:1100], alpha=0.7, label="target")
ax[i, 1].plot(time, X_source[1, i, 1000:1100], alpha=0.7)
ax[i, 1].plot(time, X_target[1, i, 1000:1100], alpha=0.7)
ax[0, 0].set_title("Class 1")
ax[0, 1].set_title("Class 2")
ax[2, 0].set_xlabel("Time (s)")
ax[2, 1].set_xlabel("Time (s)")
ax[0, 0].legend()
plt.show()
fig, ax = plt.subplots(3, 2, sharex="all", sharey="all", figsize=(8, 4))
plt.subplots_adjust(bottom=0.15)
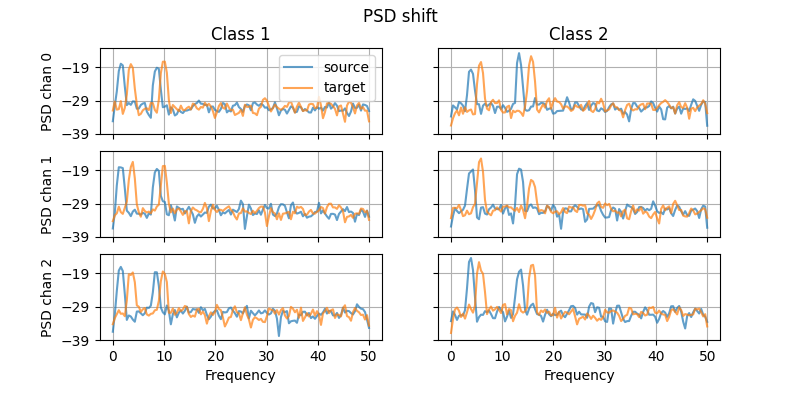
fig.suptitle("PSD shift")
for i in range(3):
ax[i, 0].psd(X_source[0, i], Fs=100, alpha=0.7, label="source")
ax[i, 0].psd(X_target[0, i], Fs=100, alpha=0.7, label="target")
ax[i, 1].psd(X_source[1, i], Fs=100, alpha=0.7)
ax[i, 1].psd(X_target[1, i], Fs=100, alpha=0.7)
ax[0, 0].legend()
ax[0, 0].set_title("Class 1")
ax[0, 1].set_title("Class 2")
for i in range(3):
ax[i, 0].set_ylabel(f"PSD chan {i}")
ax[i, 1].set_ylabel("")
ax[i, 0].set_xlabel("")
ax[i, 1].set_xlabel("")
ax[2, 0].set_xlabel("Frequency")
ax[2, 1].set_xlabel("Frequency")
plt.show()
print(f"The data was generated from (random_state={RANDOM_SEED})")
The data was generated from (random_state=948)
Total running time of the script: (0 minutes 0.583 seconds)