Note
Go to the end to download the full example code.
Using GridSearchCV with skada
This example illustrates the use of DA scorer such as ImportanceWeightedScorer
with GridSearchCV.
We first create a shifted dataset. Then we prepare the pipeline including a
base estimator doing the classification and the DA estimator. We use
ShuffleSplit as cross-validation strategy.
import warnings

import matplotlib.pyplot as plt
from sklearn.inspection import DecisionBoundaryDisplay
from sklearn.model_selection import GridSearchCV, ShuffleSplit
from sklearn.svm import SVC

from skada import EntropicOTMapping
from skada.datasets import make_shifted_datasets
from skada.metrics import PredictionEntropyScorer

warnings.filterwarnings("ignore")

RANDOM_SEED = 42
dataset = make_shifted_datasets(
    n_samples_source=30,
    n_samples_target=20,
    shift="conditional_shift",
    label="binary",
    noise=0.4,
    random_state=RANDOM_SEED,
    return_dataset=True,
)
X, y, sample_domain = dataset.pack(
    as_sources=["s"], as_targets=["t"], mask_target_labels=True
)
X_target, y_target, _ = dataset.pack(
    as_sources=[], as_targets=["t"], mask_target_labels=False
)

estimator = EntropicOTMapping(base_estimator=SVC(probability=True))
cv = ShuffleSplit(n_splits=5, test_size=0.3, random_state=RANDOM_SEED)
We want to perform a grid search to find the best regularization parameter
for the DA estimator. The DA pipeline can directly be used in GridSearchCV.
We use the PredictionEntropyScorer
to evaluate the performance of the DA estimator during the grid search.
reg_e = [0.01, 0.03, 0.05, 0.08, 0.1]

grid_search = GridSearchCV(
    estimator,
    {"entropicotmappingadapter__reg_e": reg_e},
    cv=cv,
    scoring=PredictionEntropyScorer(),
)

grid_search.fit(X, y, sample_domain=sample_domain)

best_reg_e = grid_search.best_params_["entropicotmappingadapter__reg_e"]
print(f"Best regularization parameter: {best_reg_e}")
Best regularization parameter: 0.08
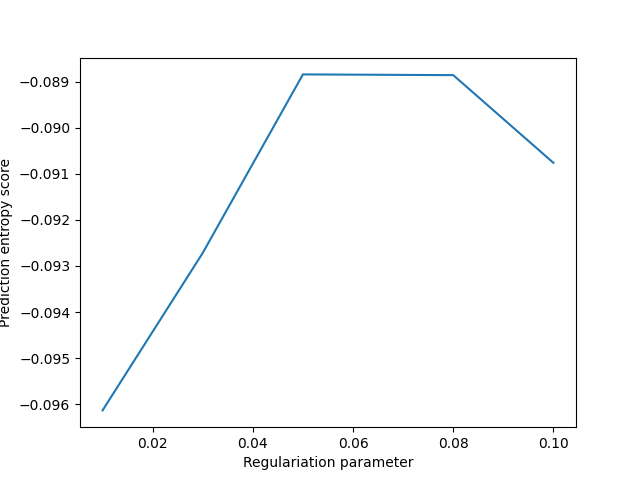
Plot the results
plt.plot(
    grid_search.cv_results_["param_entropicotmappingadapter__reg_e"],
    grid_search.cv_results_["mean_test_score"],
)
plt.xlabel("Regulariation parameter")
plt.ylabel("Prediction entropy score")
plt.show()
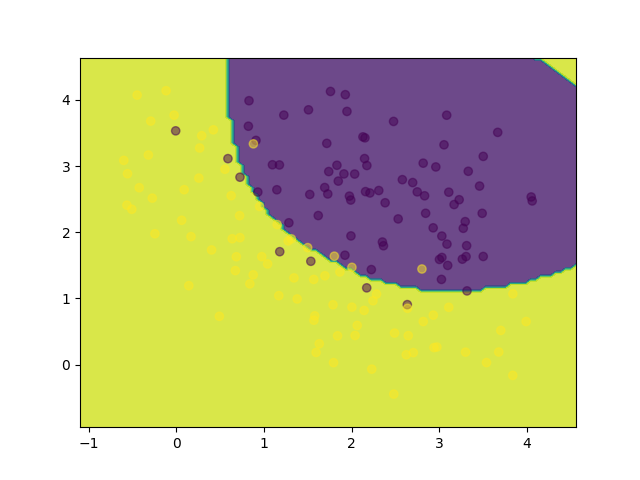
DecisionBoundaryDisplay.from_estimator(
    grid_search.best_estimator_,
    X_target,
    alpha=0.8,
    eps=0.5,
    response_method="predict",
)

# Plot the target points
plt.scatter(
    X_target[:, 0],
    X_target[:, 1],
    c=y_target,
    alpha=0.5,
)
plt.show()
Total running time of the script: (0 minutes 20.412 seconds)